This is the third roundup of my Android Studio Daily Tips that I post on Google+
You can take a look at the previous post here.
About Keymaps
Android Studio provides different keymaps (the mapping between shortcut keys and an action). You can see which keymap you are using in Settings->Keymap.
It wouldn’t be practical to list the shortcuts for every keymap so the following will be used:
- Windows: Default
- Linux: Default
- OSX: Mac OSX 10.5+
Toggle Breakpoints
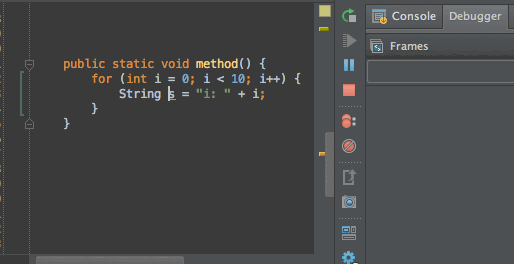
The next few tips will be about debugging. So let’s start with the most basic one: adding a good old breakpoint!! I am pretty sure that by now you have debugged an app and know how to toggle it by left-clicking in the left gutter. Here is the correct shortcut to toggle it without your mouse.
Shortcut:
- OSX: Cmd+F8
- Windows/Linux: Ctrl+F8
Conditional Breakpoints
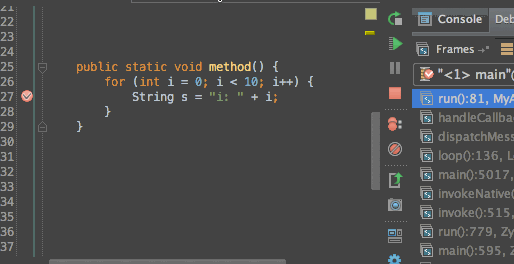
In a nutshell, only do break when a certain condition is met. You can enter any java expression that returns a boolean based on the current scope. And do enjoy the fact that the condition textbox supports code completion!
Shortcut:
- Right click on a breakpoint and enter a condition.
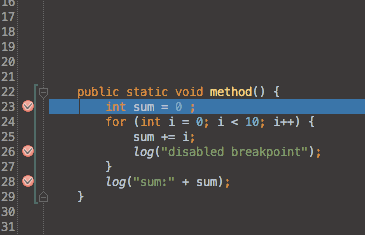
Logging Breakpoints
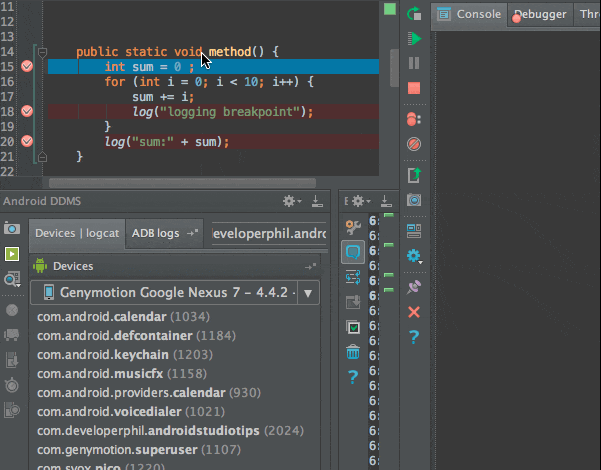
This is a breakpoint that logs stuff instead of breaking. This can be useful when you want to log some stuff right now but cannot or don’t want to redeploy with logging code added.
Shortcut:
- Right click on a breakpoint, uncheck Suspend and type your message in “Log evaluated Expression”
Temporary Breakpoints
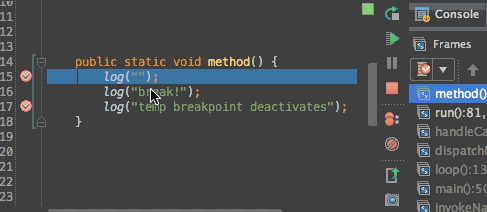
This is a way to add a breakpoint that will be removed automatically the first time you hit it.
Shortcut:
- Mouse: Alt+LeftClick in the left gutter
- Mac: Cmd+Alt+Shift+F8
- Windows/Linux: Ctrl+Alt+Shift+F8
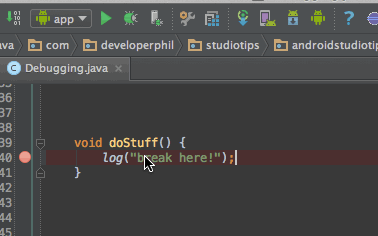
Disable Breakpoints
This will disable the breakpoint. Particularly useful when you have some complicated conditional or logging breakpoint that you don’t need right now but don’t want to recreate next time.
Shortcut:
- Mouse: Alt+LeftClick on an existing breakpoint in the left gutter
- There is no keyboard shortcut but you can create one if you use it often enough.
Attach Debugger
Start debugger even if you didn’t start the app in debug mode. This is very useful since you don’t have to redeploy the app to start debugging. It is pretty useful also when somebody is testing the app, encounters a bug and give you his device.
Shortcut:
- Mouse: click on its icon or select the menu item Build → Attach to Android Process
- There is no keyboard shortcut but you should create one!
Evaluate Expression
This is used to inspect a variable’s content and evaluate pretty much any valid java expression right there, right now. Just be aware that if you are mutating state, it will stay that way when you resume the execution of the program.
Shortcut:
- Alt+F8
Inspect Variable
This evaluates an expression without opening the Evaluate Expression dialog
Shortcut:
- Alt+LeftClick on an expression
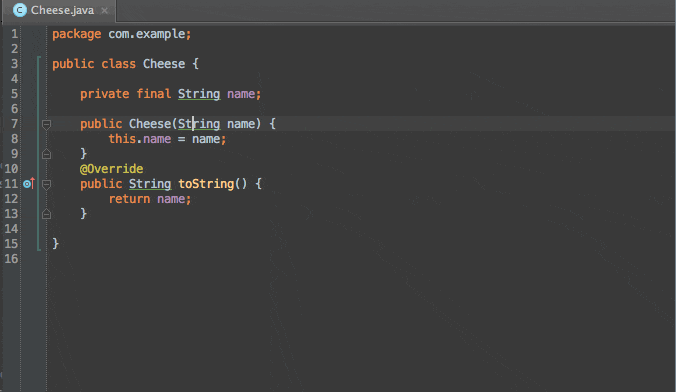
Mark Object
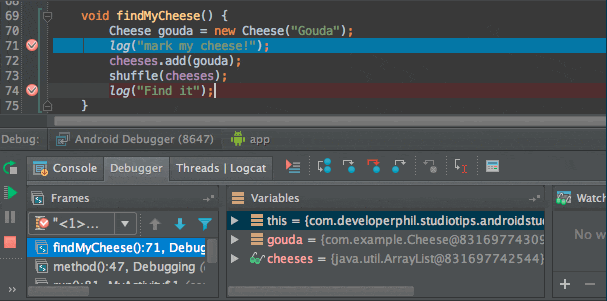
During a debugging session, this will let you add a label to a particular object so that you can identify it later. Very useful in those debugging sessions where you have a bunch of similar object and you want to know if it is the same one as before.
Shortcut (from the variables or watch panel):
- Mouse: right-click and select “Mark Object”
- OSX : F3 with the object selected
- Windows/Linux: F11 with the object selected
Analyze Stacktrace
This will take a stacktrace and make it clickable just as if it had been shown in logcat. This is particularly useful when copying a stacktrace from a bug report or from a terminal.
Additional tip:
- You can also analyze a proguarded stack trace using the “ProGuard Unscramble Plugin”
Shortcut : There is no shortcut for this…
- Menu: Analyze → Analyze Stacktrace
- Find action: analyze stacktrace